Your whole network, from activated broker to sale.
When you sign in to KOBI, you see your partner brokers' funnel: activated, in use, visit, simulation, reservation and sale. Every number opens the list of brokers behind it.
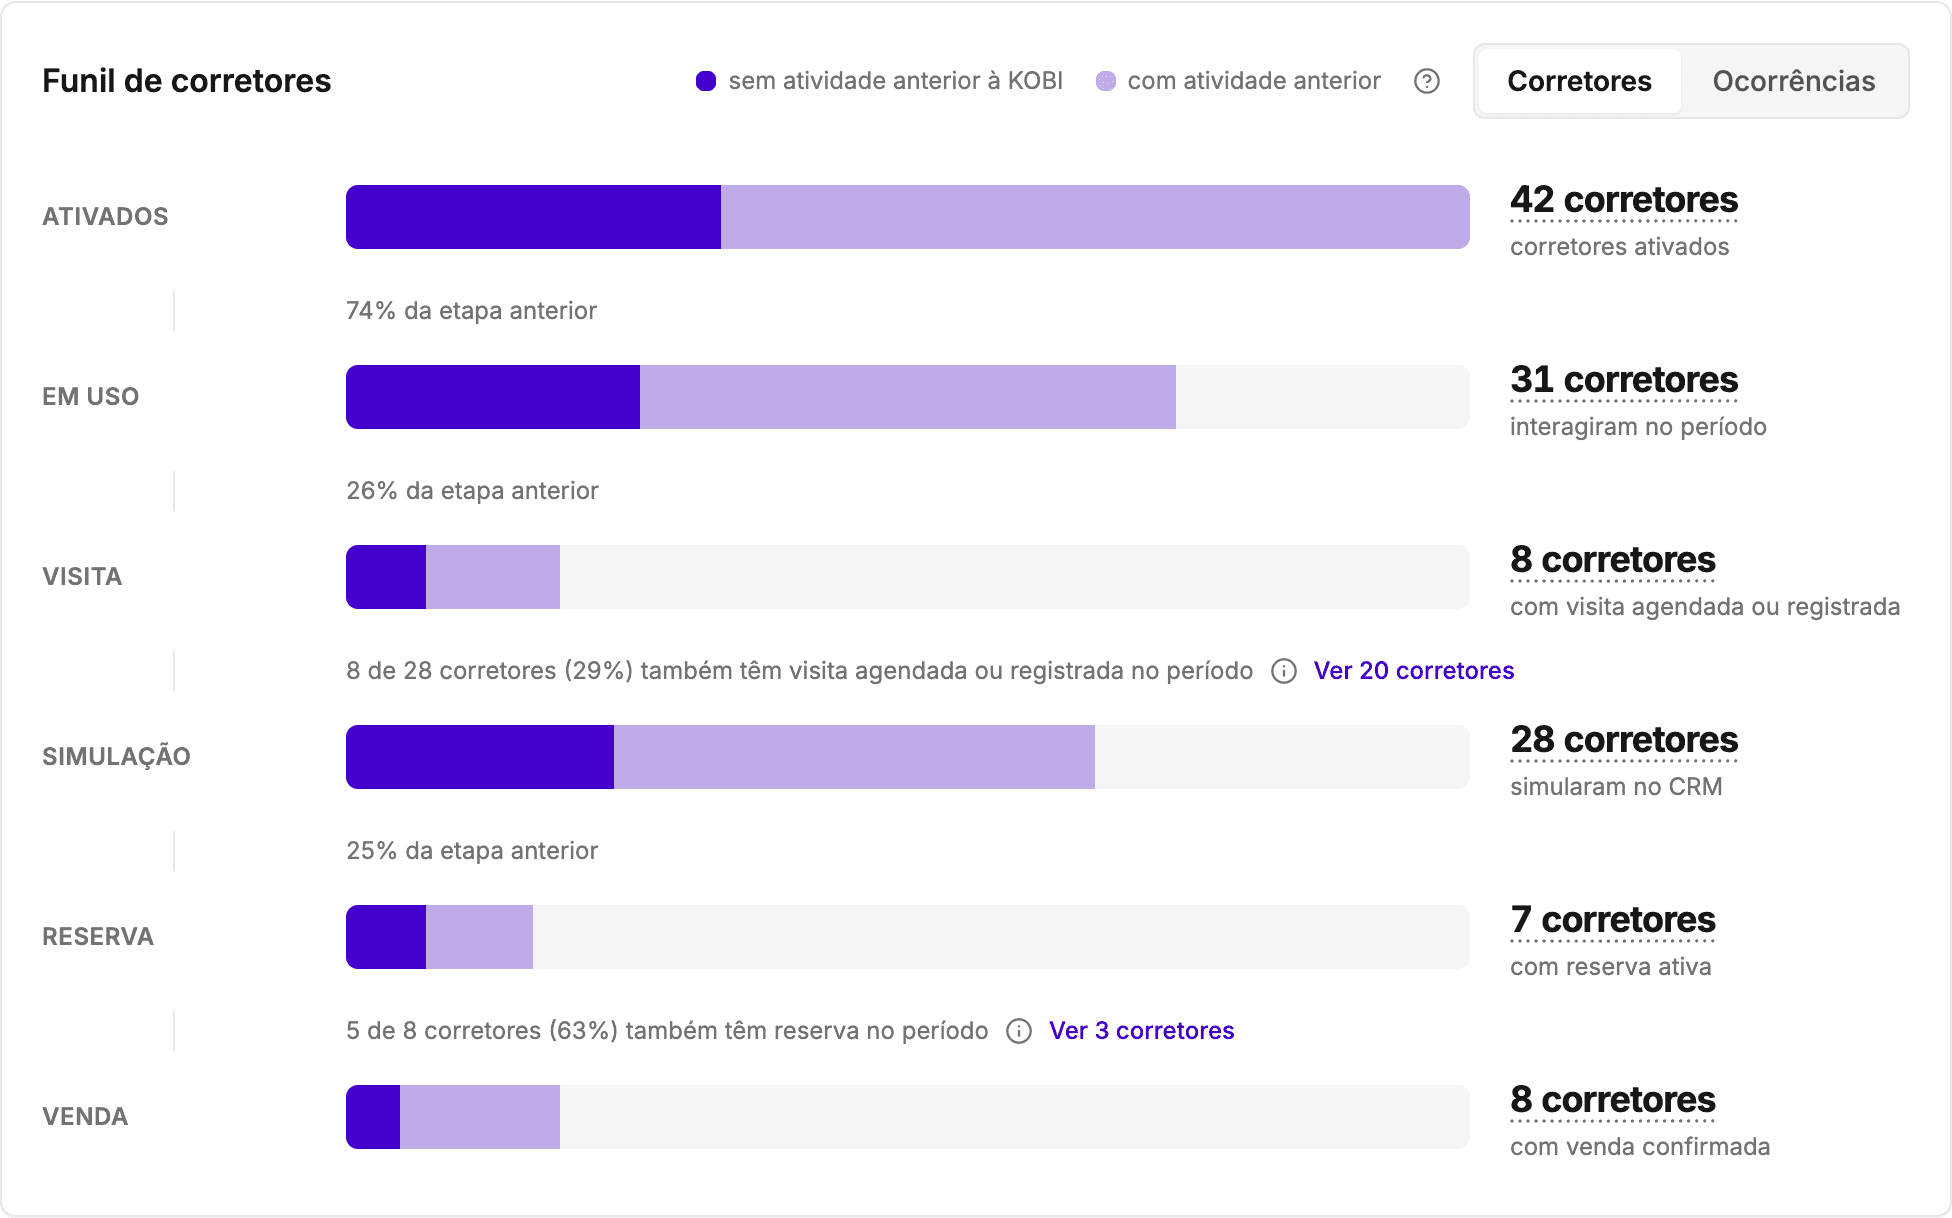
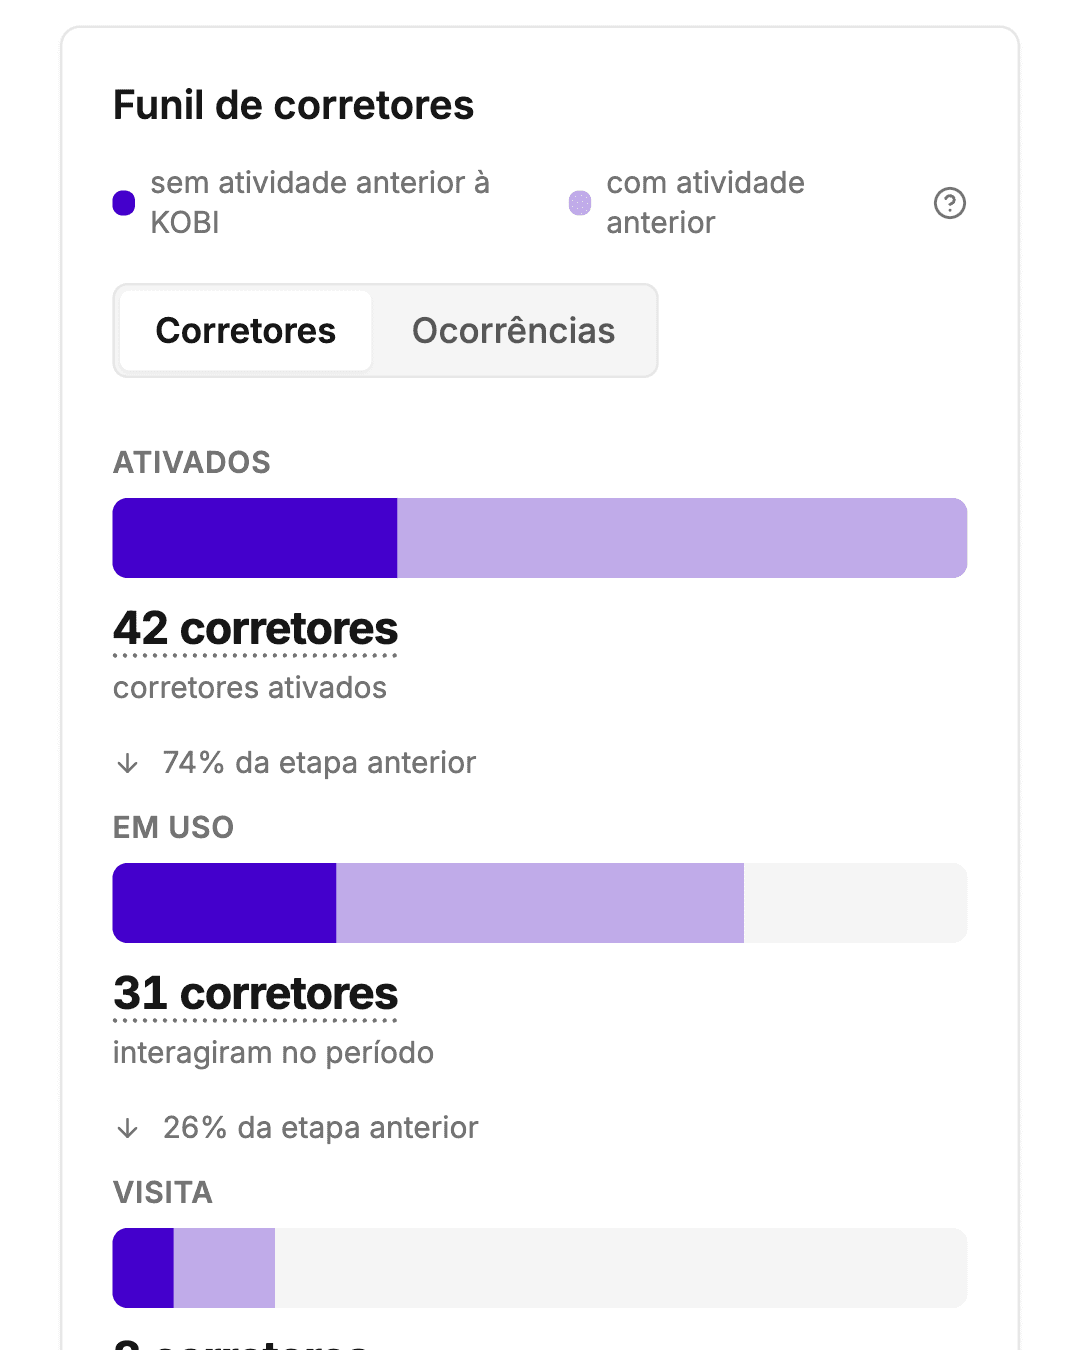
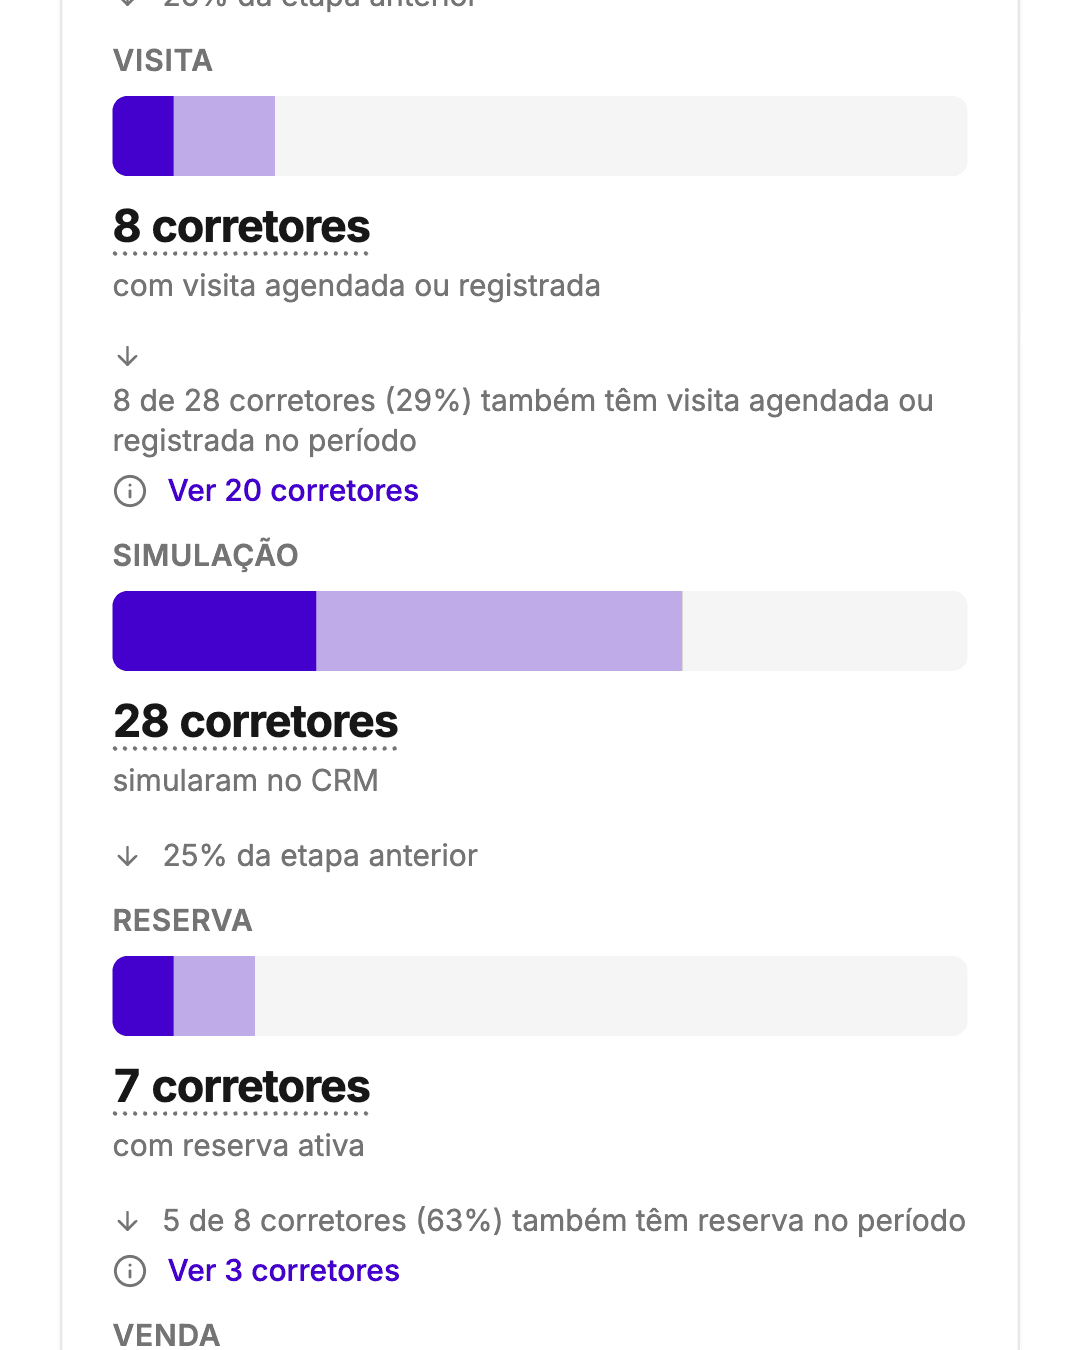
Every step has names. Click and see the brokers.
- 01
Click a number, see the brokers
The numbers in the funnel, the cards and interactions by type open the list of brokers behind them, with each one's agency, how many times they did it and when they last did. Click a name to open that broker's history.
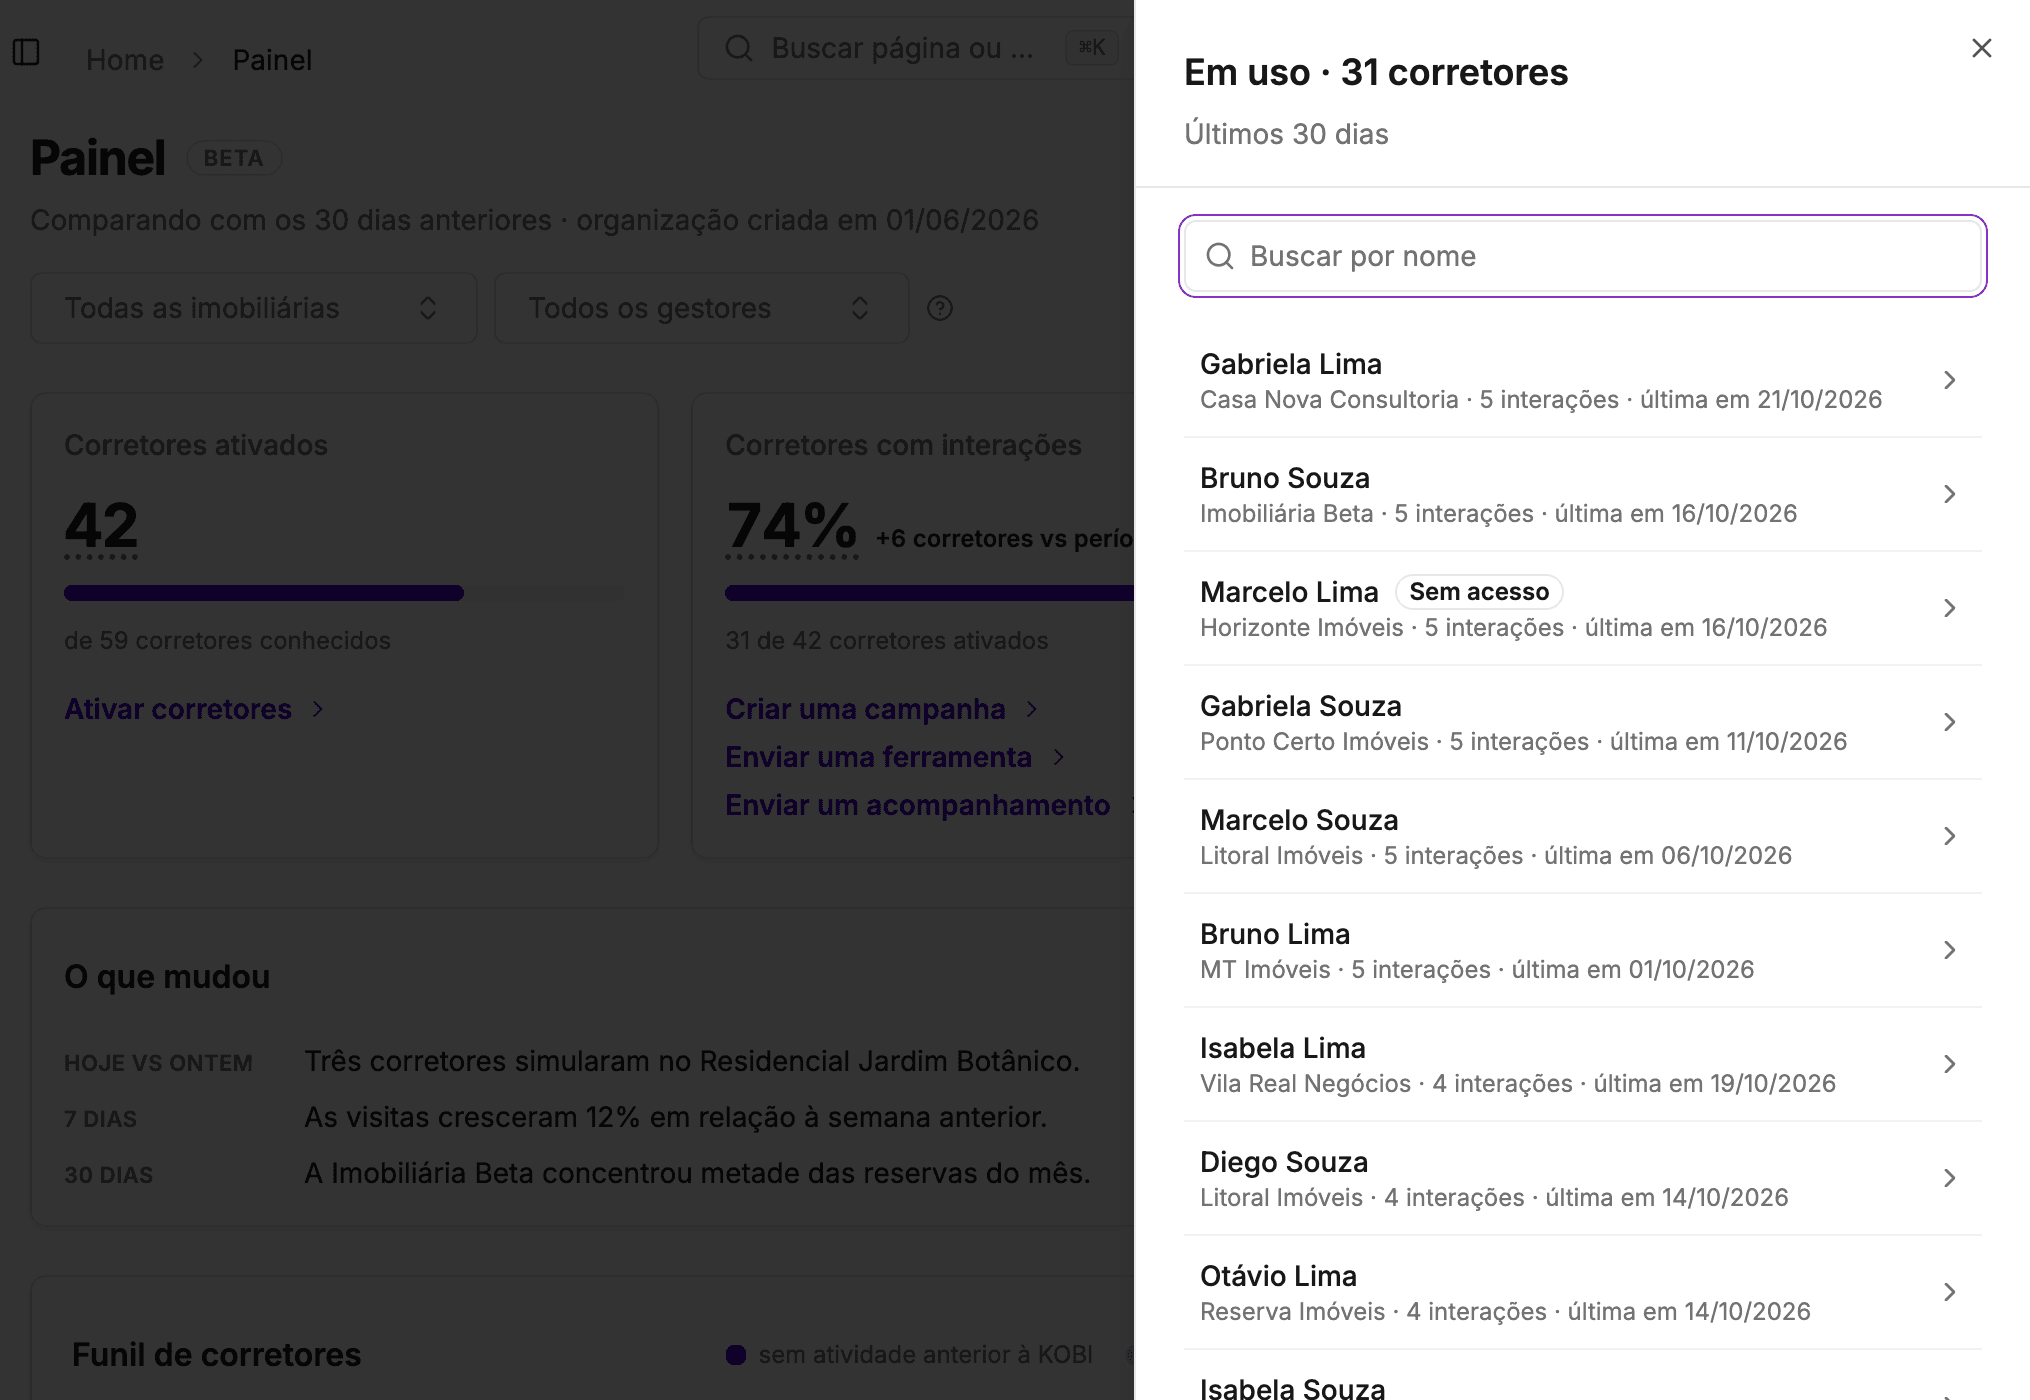
Illustrative image · fictional data 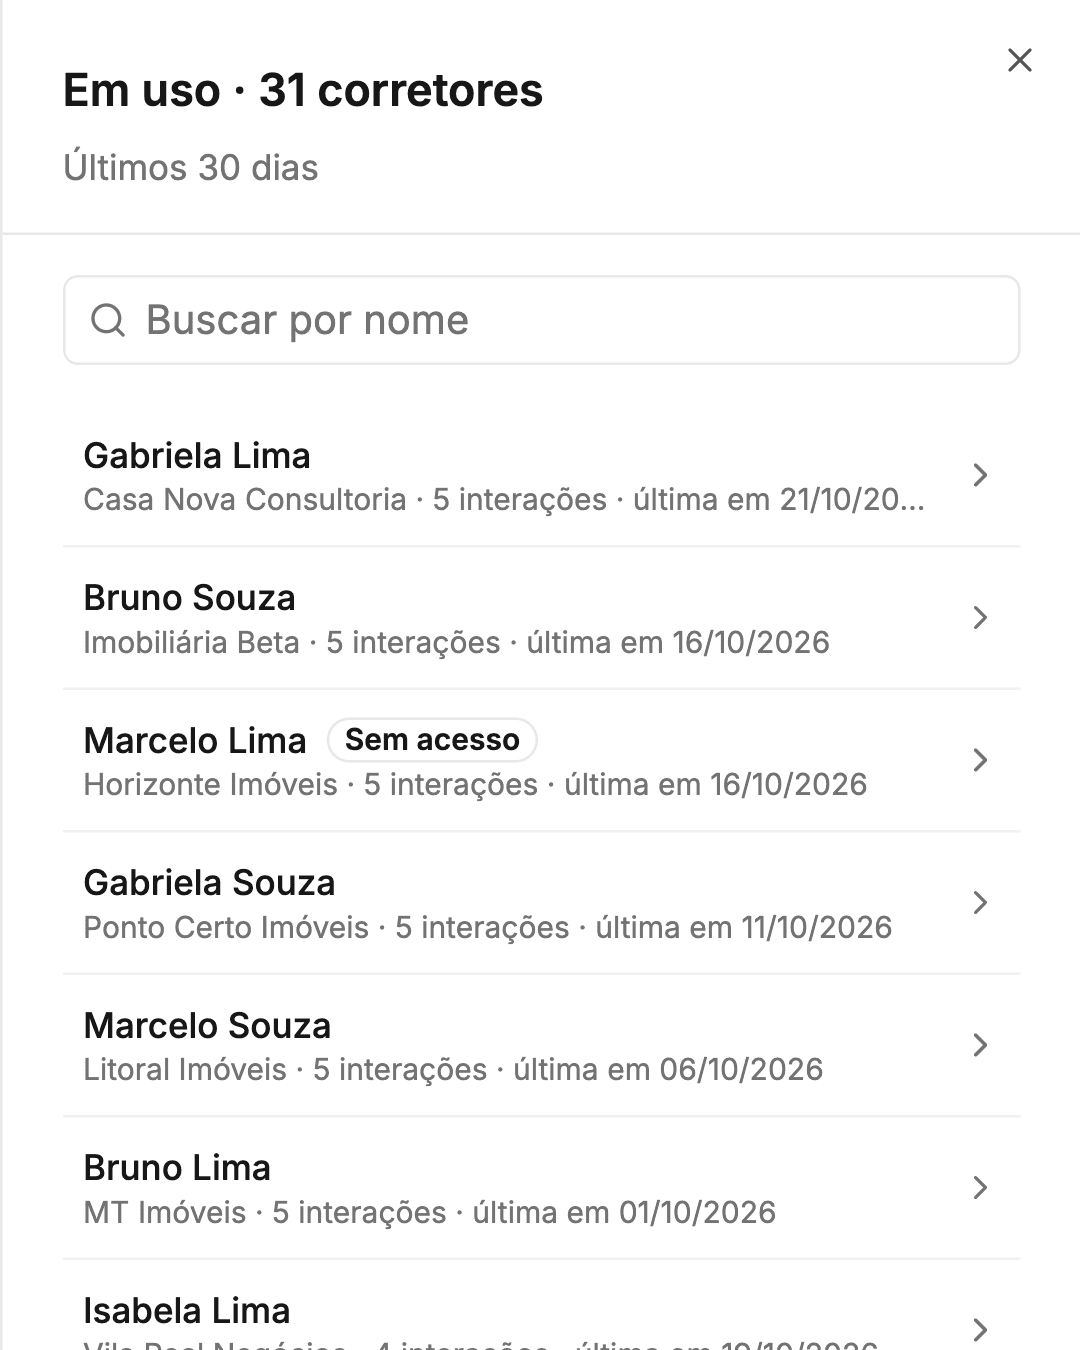
- 02
See how far each agency has come
The agency list shows the steps each one has reached (registration, training, simulation, reservation and sale), its last check-in and how many of its brokers are activated. Filter the dashboard by agency or by the manager who does the check-ins.
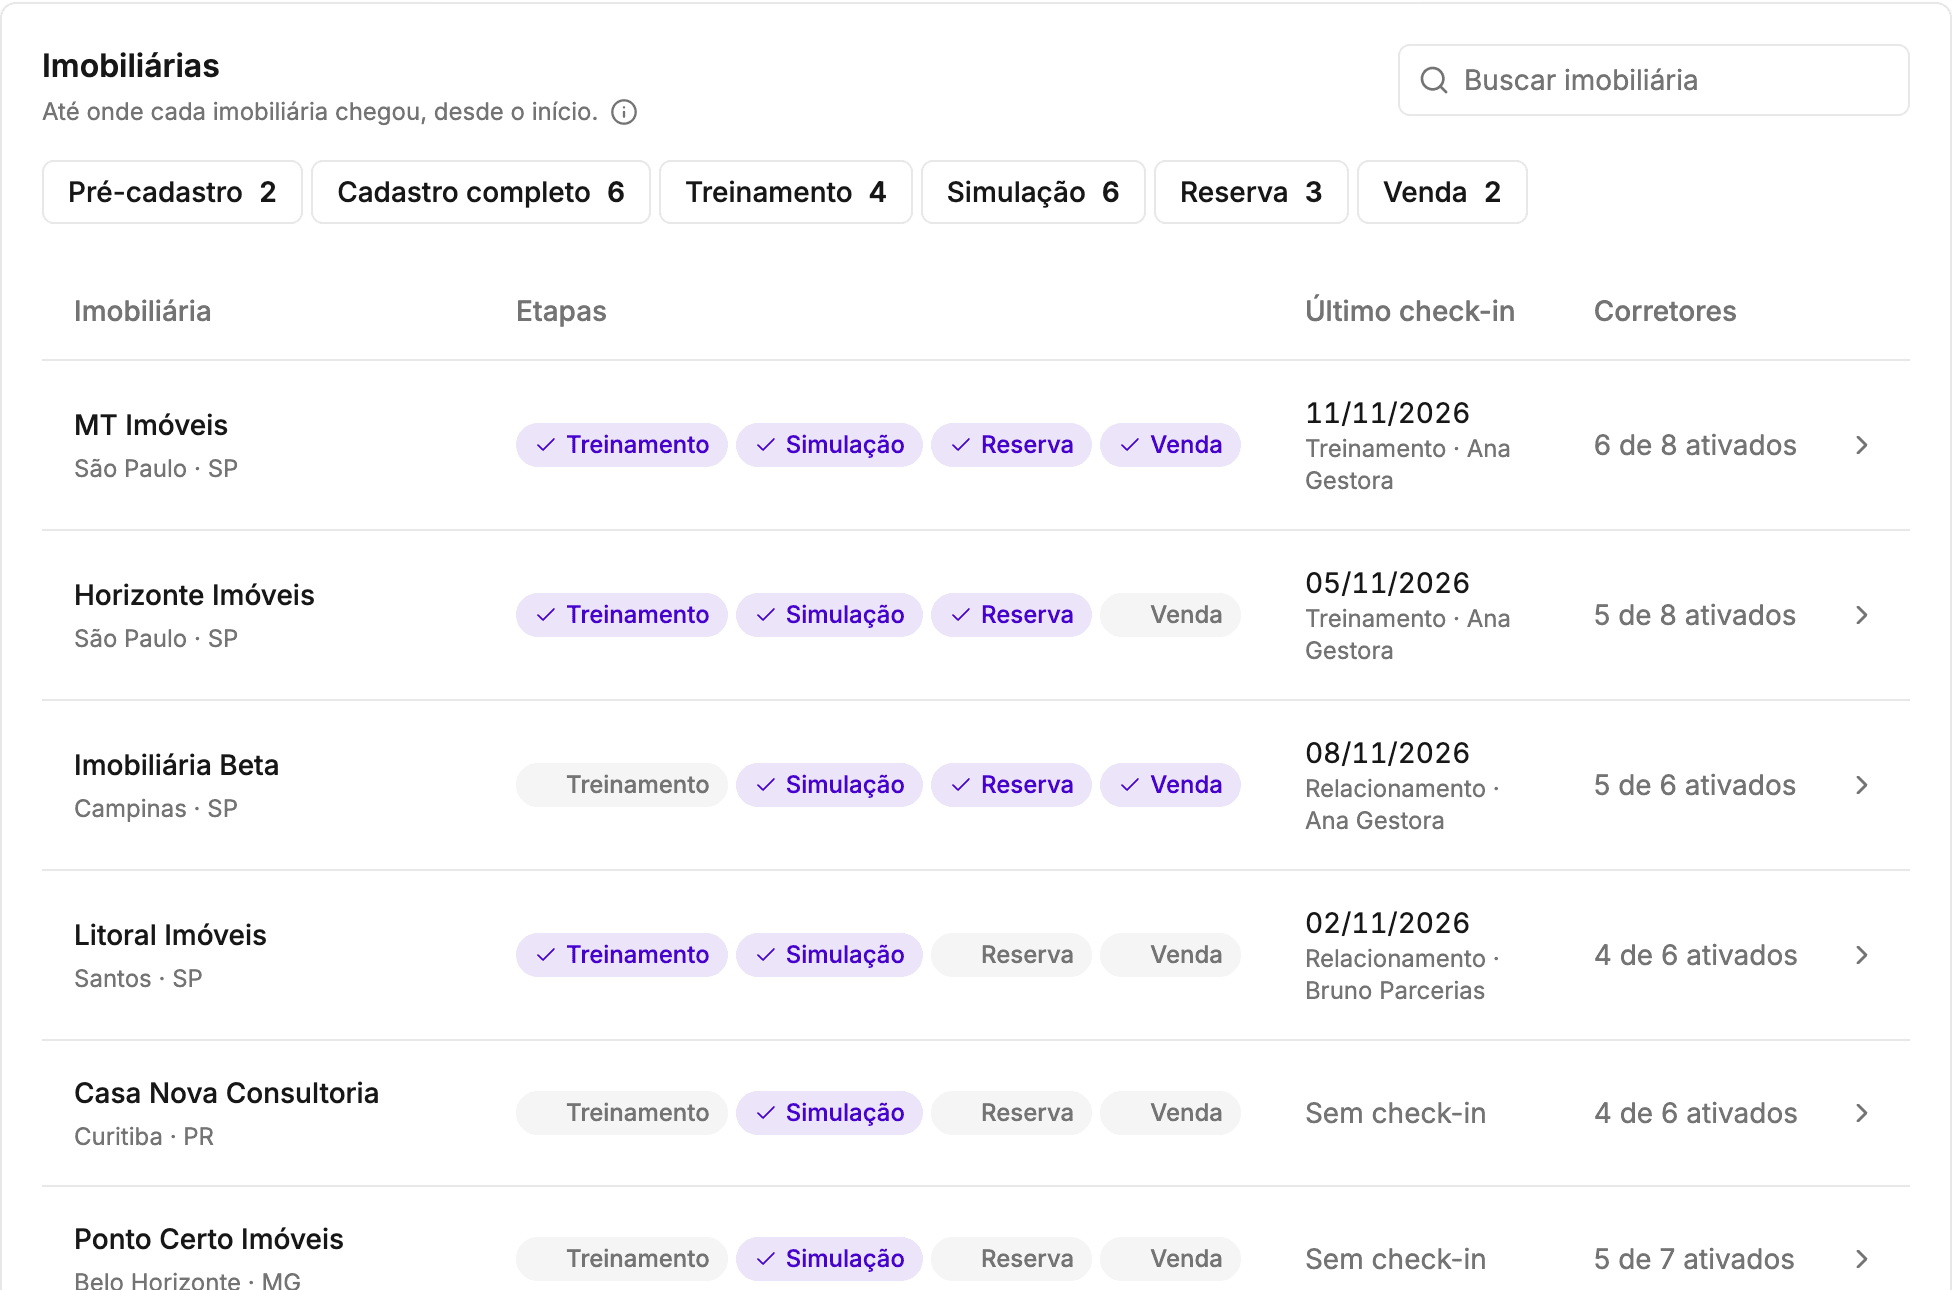
Illustrative image · fictional data 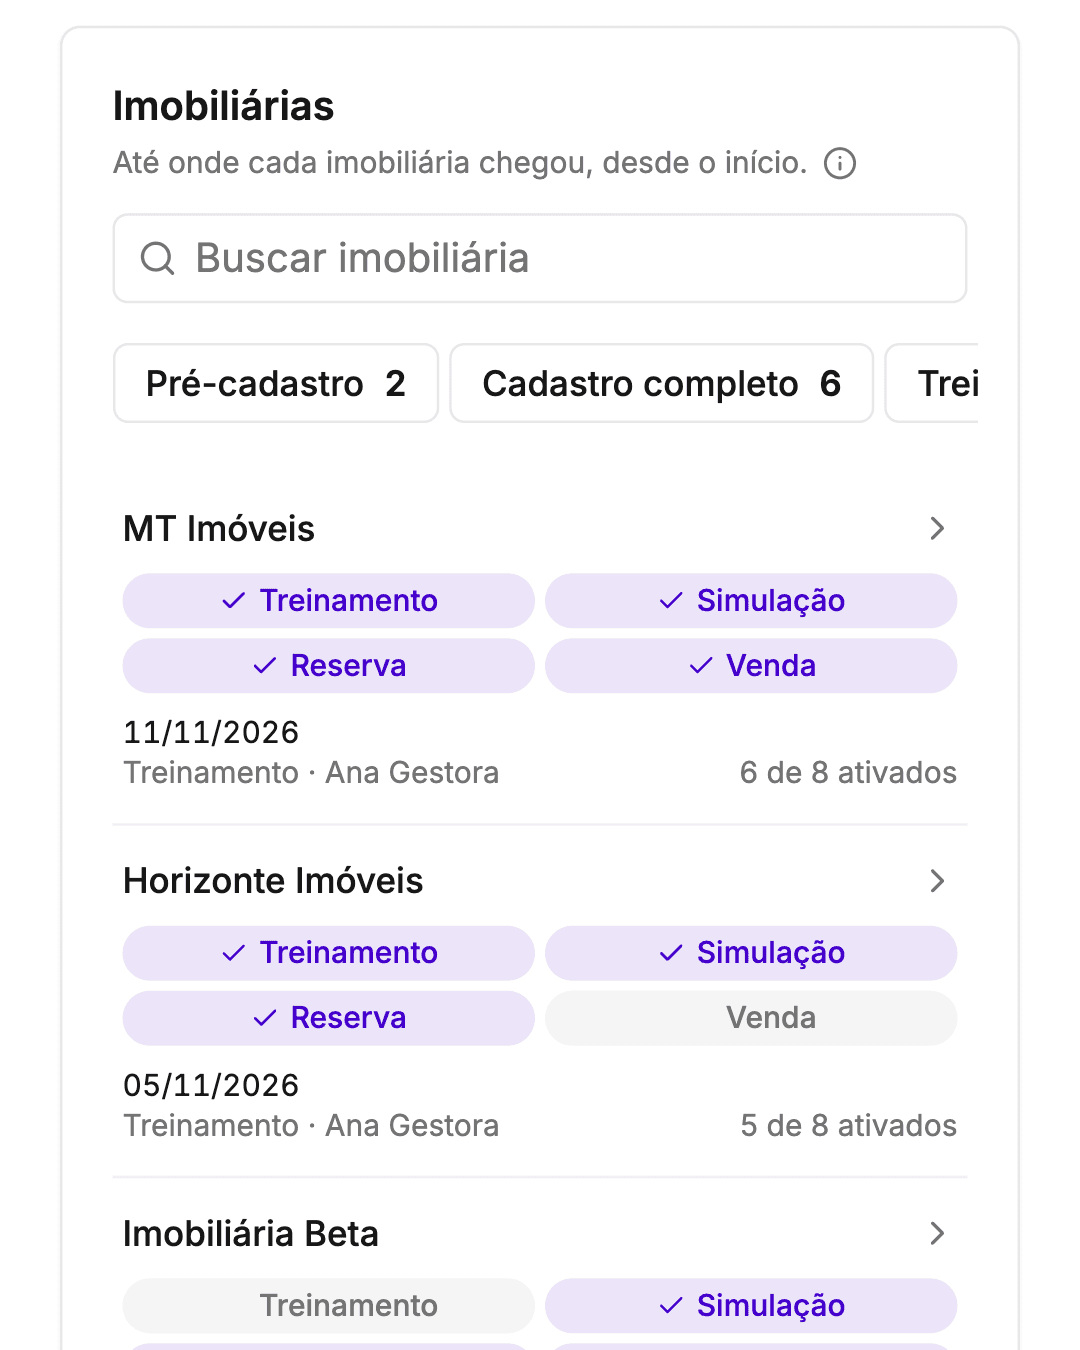
- 03
What changed, written by AI
KOBI sums up in one sentence what changed today compared with yesterday, over the last 7 days and over the last 30 days. The summary updates during the day, and the Refresh button asks for a new one.
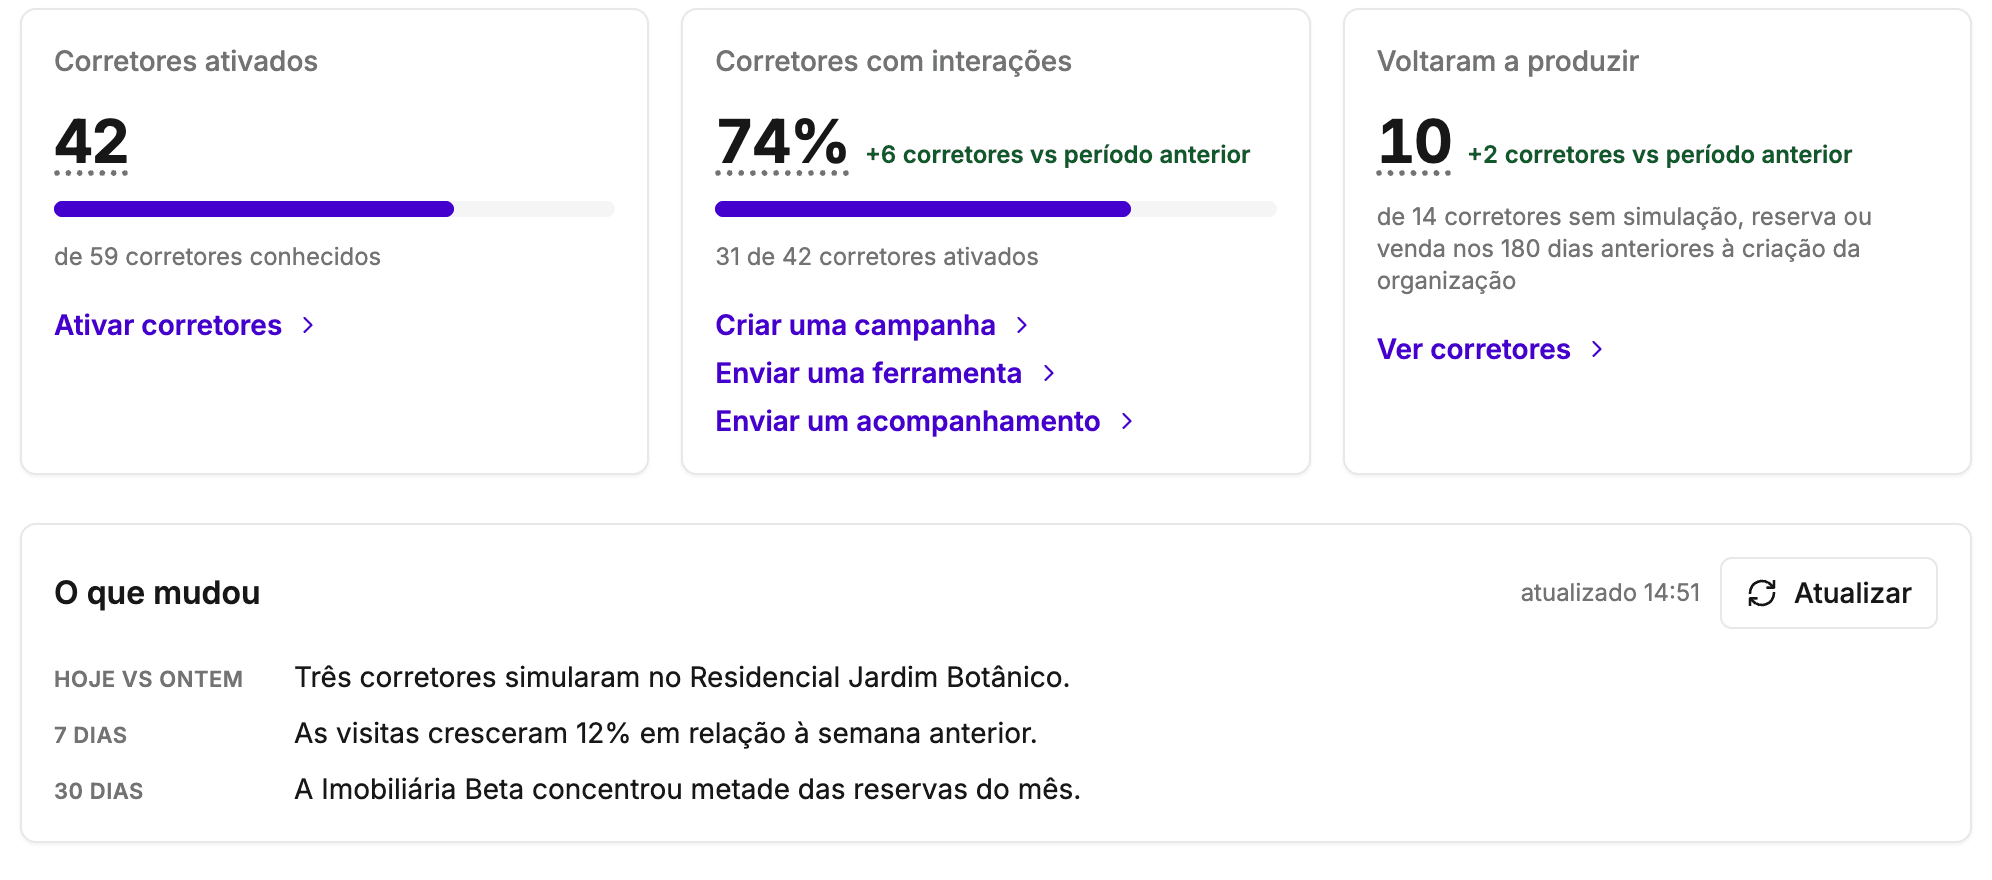
Illustrative image · fictional data 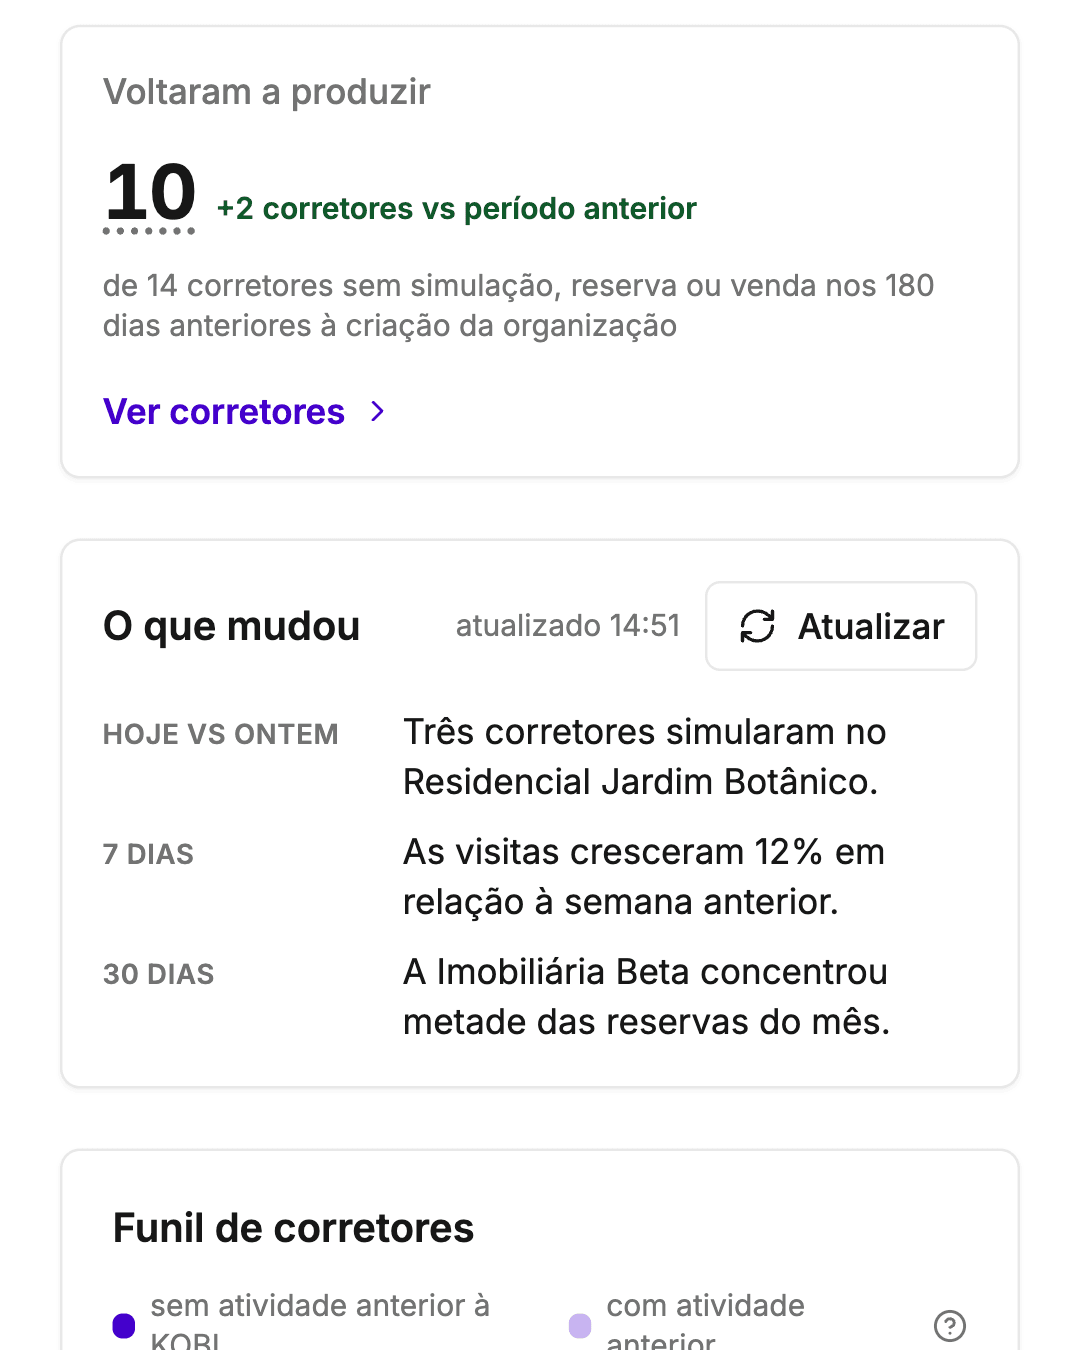
- 04
Before and after each check-in
On the Impact tab of the check-ins page, each agency is compared before and after its first check-in in the period, over windows of the same length: activated, in use, visits, simulations, reservations and sales. It shows what changed without claiming the check-in caused it.
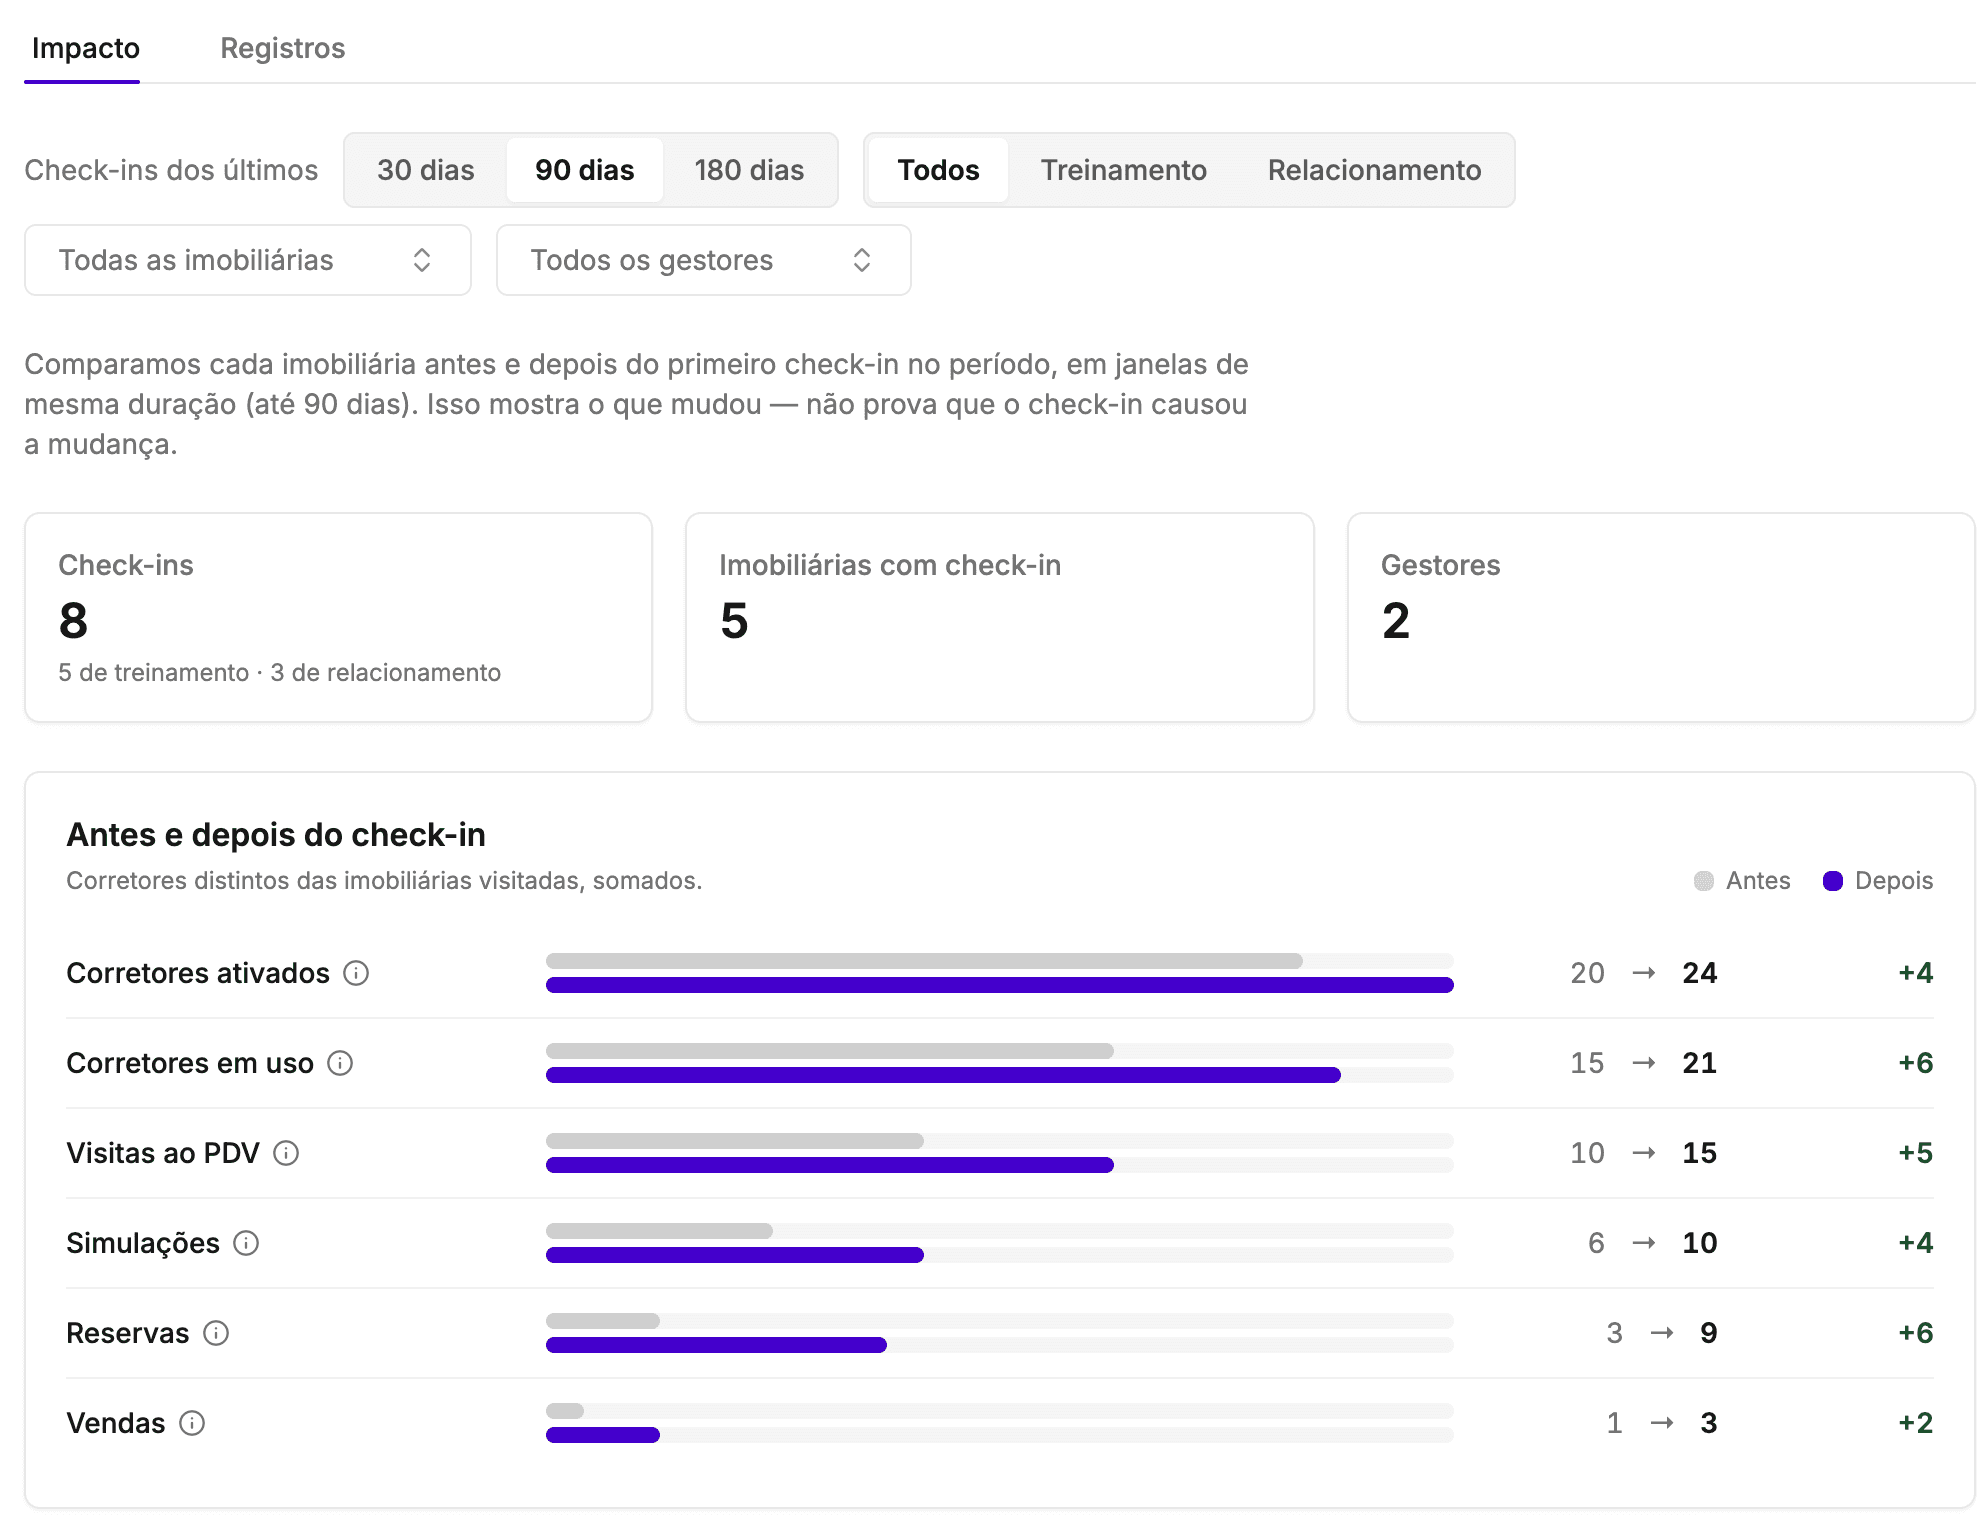
Illustrative image · fictional data 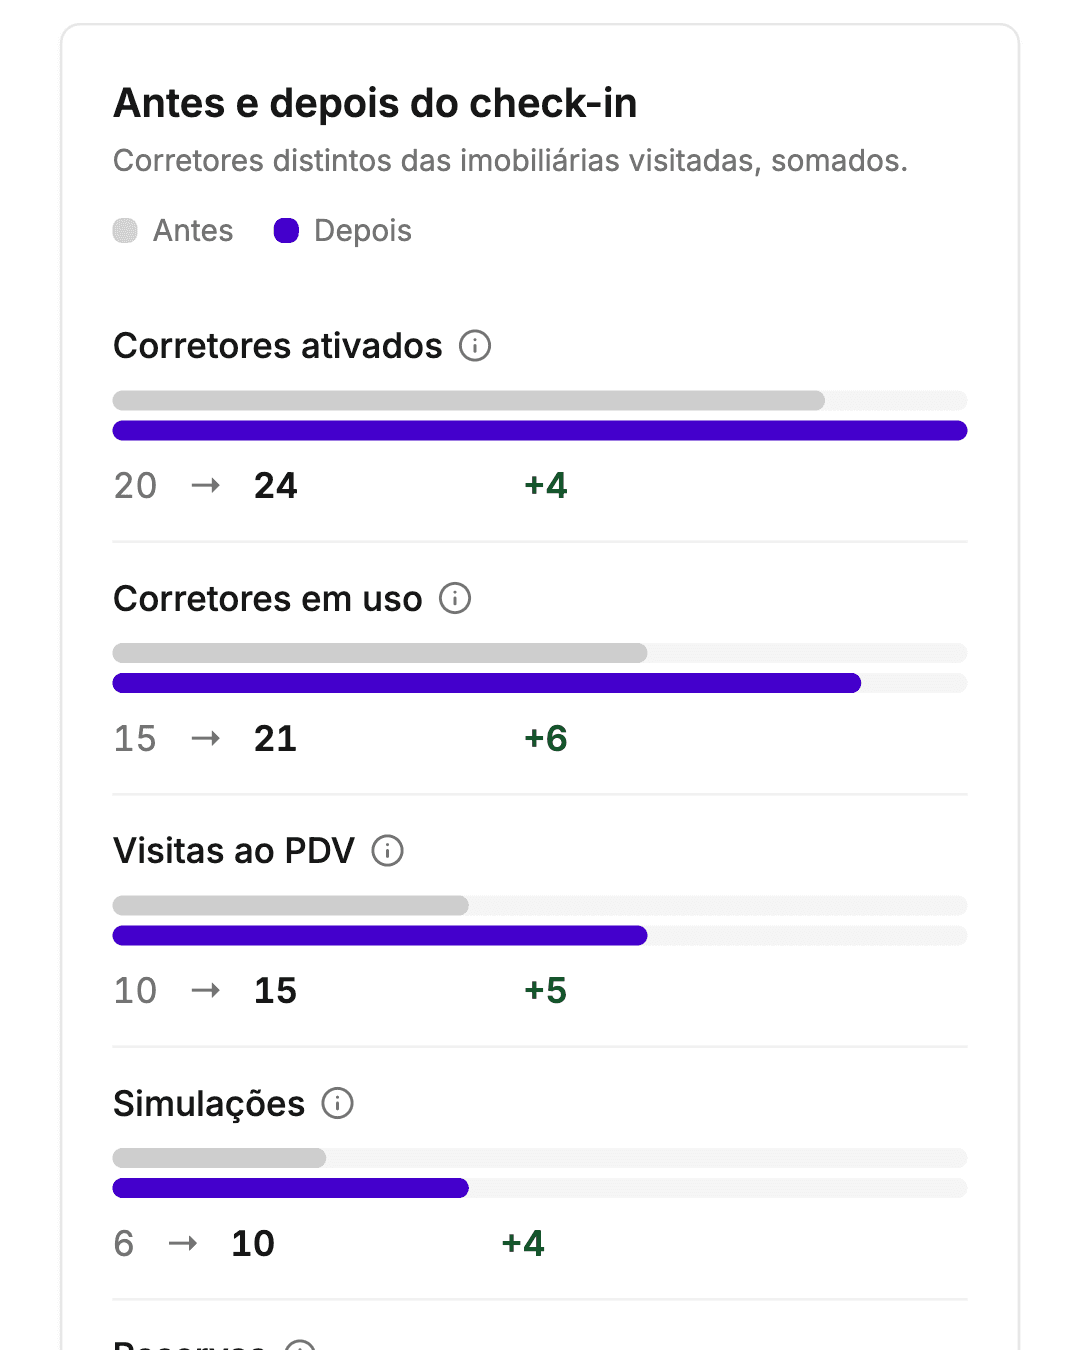
More than the funnel.
- 01
Who reacted to sends
Every send goes into the same count (enablement, broker tools, construction updates, events and more): how many brokers who received a send reacted within 3 days.
- 02
Who started producing again
Brokers with no simulation, reservation or sale in the 180 days before the organization joined KOBI who are simulating, reserving or selling again.
- 03
Brokers or occurrences
Count the funnel in brokers or in occurrences: how many people visited, or how many visits happened.
- 04
Interactions by type
What counts as KOBI usage in the period, type by type: price table views, content accessed, tools opened, construction updates and more.
- 05
7, 30 or 90 days
Pick the period and compare it with the previous period of the same length.
- 06
Before and after KOBI
Each step separates the brokers who were already producing before KOBI from those with no earlier activity.
See where
your network stalls
and where it sells.
Book a demo and see how the dashboard follows your partner broker network, from activated broker to sale.